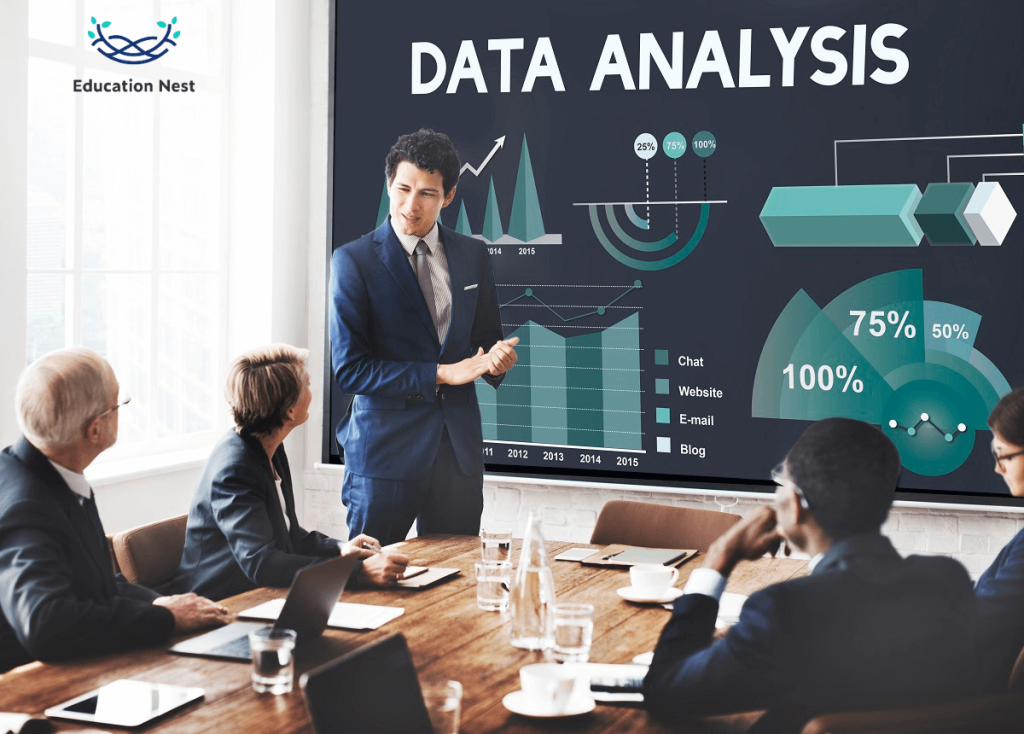
SAS Analytics, formerly known as Statistical analysis system, is a business analytics intelligence tool which helps analyses, data mining and reporting by providing powerful visualizations and interactive dashboard. The use for these types of tools is increasing every day and you should know about these tools to accelerate your data analytics skills for the smooth run of your business.
In this blog post we will discuss about the business intelligence tool SAS, what is sas analytics pro, what is sas analytics tool, what is sas visual analytics, what is sas office analytics
What is SAS analytics pro?
SAS Analytics Pro is a powerful package that is easy to use and lets you get to, change, analyze, and show information. It helps groups be more productive by giving them all the tools and methods they need for desktop data analysis in one package.
Organizations can get research, reporting, and visualizations that are easy to understand from the same company. This consolidated portfolio saves you from having to put together niche software packages from different vendors. It also lowers the cost of licensing, maintenance, training, and support, and makes sure that your business has access to the same information.
Build analytical graphs, maps, and charts easily with almost any type of output, so you can get analytical results where they’re needed most.
SAS software can be used in almost any computing setting. This makes it easier to get a single view of your data and gives analysts more time to focus on analysis instead of data problems.
You Must Know: The Ultimate Guide: 13 Salesforce Interview Questions and Best Answers for 2023
What is SAS visual analytics?
SAS Visual Analytics gives you a full platform for visualizing analytics. This lets you find patterns and connections in data that weren’t obvious at first. Advanced analytics right out of the box are mixed with interactive, self-service BI and reporting features so that anyone can find insights in any size or type of data, even text.
Main features of SAS BI and Analytics
Better presentation of visual data:
It makes reports, charts and visuals from the data
- Gives better understanding of complex data
- Gives trend analysis
- Explores more opportunities
- Spots unprecedented patterns
Gives meaningful and easy to understand analytics
- Identifies correlations
- Helps to spot outliners
- Gives predictions of future outcomes and trends
Gives interactive dashboards and self service of ad hoc reporting
- Helps you make reports on your own that are good enough to send out.
- Reports are easy to make, and management leaders can do it on their own.
- Data access, mash-up, filtering, and data processing are already built in.
Gives mobile app- BI on the go
- Mobile BI App that works on both iOS and Android
- Easy to keep an eye on business from anywhere, at any time, 24/7.
- Simple to use and control
- Dashboards, charts, and reports are easy to get to and work with.
Excel and Outlook from MS Office can be used easily.
- SAS BI and Analytics Can Be Used With Microsoft Office
- Using Microsoft Office to make reports
- MS Office is used to send out results.
- Storyboards or the making of stories
Benefits of SAS BI and SAS Analytics

- Can handle large databases: SAS has s strong ability to handle large database easily.
- Gives data security: Data in SAS is completely safe. Without a license, we can’t take out, in case of office use. Data security stops it from being changed. And this is why it is very famous in the business world.
- SAS Visual Data Exploration helps you make charts and graphs that look good and get the attention of business users who might not have been interested in the data otherwise. This tool looks at a lot of information and shows the results as graphs, charts, and other interesting pictures.
- Business leaders like to use Microsoft Excel and other tools from the Office suite. With this function, business users can access SAS BI and Analytics and use Microsoft Office tools to make reports. They can also send these results out through Microsoft Office. Storyboards and tales help people who make decisions share important information and ideas.
Conclusion
In the end it can be said that Business Intelligence and Analytics are now a must-have for all big and medium-sized businesses around the world. SAS is the market leader in this area and has the biggest part of the advanced analytics market. As more and more businesses around the world use SAS BI and Analytics software, there is a sharp rise in the need for people who know how to use it. On the world job market, there are a lot of SAS BI and Analytics jobs, and most of them pay well.
We have tried to cover everything related to SAS BI.
