Are you someone who is wondering how to do data analysis using SPSS? Do you wish to know SPSS in detail? If so, this blog is for you! To begin with, let us understand what SPSS is. The term “SPSS” refers to the Statistical Package for the Social Sciences. A family of data analysis programmes known together as SPSS The data analysis software SPSS is its main selling point. The result is that researchers in the academic world may examine data without resorting to complex statistical methods. Many researchers rely on it for complex statistical analyses. SPSS was first released in 1968, then IBM purchased it in 2009.
While IBM SPSS Statistics is the formal name, many users generally refer to it simply as SPSS. The programme has an emphasis on ease of use rather than a full complement of features and options. That sums up the fundamentals of SPSS. In this blog, we’ll talk about using SPSS for data analysis, and you’ll find out all the information you need to know to get started.
What are the basic features of SPSS?
- Analytical software for quantitative data: bivariate statistics, cross-tabulations, and frequency distributions are all part of it.
- It is modelling software that can make accurate forecasts. Researchers can use sophisticated statistical methods to construct and test their prediction models.
- Text analysis can be used to look for patterns in qualitative data that were collected through free-form surveys.
- Researchers can make use of the visualisation designer’s flexibility to create a wide range of visuals from their data.
Besides these four features, you can also learn the analysis of data using SPSS. Because the solution has data management technologies like FHIR, researchers can choose cases, make derived data, and reformat files.
What features of SPSS make it a preferable analysis tool?
Being a popular tool, “how to use SPSS software for data analysis” is a question which keeps coming up in people’s minds who are not familiar with the features of SPSS. Research, experimentation, and informed decision-making are all facilitated by SPSS, making it a widely used programme. As a result of its many useful features, it has become one of the most widely used pieces of statistical software in the world. Some of them are listed below.
- Users can utilise SPSS tools to gather every bit of data needed to run descriptive, inferential, and multivariate statistical analyses on their data.
- With SPSS’s Data Mining Manager, analysts can do advanced keyword searches, use decision trees to find data that had been buried, make neural networks powered by AI, and divide the market into different subsets.
- The SPSS programme can perform calculations in algebra, geometry, and trigonometry.
- The Report Generator in SPSS allows you to create professional-looking summaries of your research. The content of the report, as well as the statistics, graphs, and analytical results, are all in one document.
- SPSS further provides data documentation. Researchers can use it to keep track of a directory of metadata. It also stores information about the data’s context, such as where it came from, how it was formatted, and what it was used for.
Related Post: Basic and Advanced Data Analysis using Excel: Overview, Benefits, Learning, and Career Opportunities
The Advantages of SPSS in Survey Data Analysis
When doing analysis of data using SPSS, there are the following advantages-
- SPSS Data Analysis is a helpful tool for several reasons, including the fact that it doesn’t require a lot of work from the researcher.
- For researchers who need to sort through a lot of numerical data and information to come to meaningful conclusions, SPSS is a good choice because it can analyse the data quickly.
- Its quick turnaround time for data analysis makes it an attractive option for researchers who need to sift through large amounts of numerical data and information to draw meaningful conclusions.
- The primary features include the ability to create statistical models, do text analysis inside survey software, and create graphic displays. These steps allow researchers to methodically analyse their data.
- This software’s primary use case is in doing in-depth statistical evaluation and analysis of scientific data for the objectives of sociology and other types of research. The information within can be put to many productive uses, including but not limited to surveys, market analyses, data mining, etc.
- It starts by storing and organising the data in a way that is in sync with the rest of the system. This is done so that the analytical performance can be done well.
- SPSS was made so that it could handle a large amount of data in different formats. This makes it easier to get useful results from the data set.
Step by Step process of analysing data using SPSS
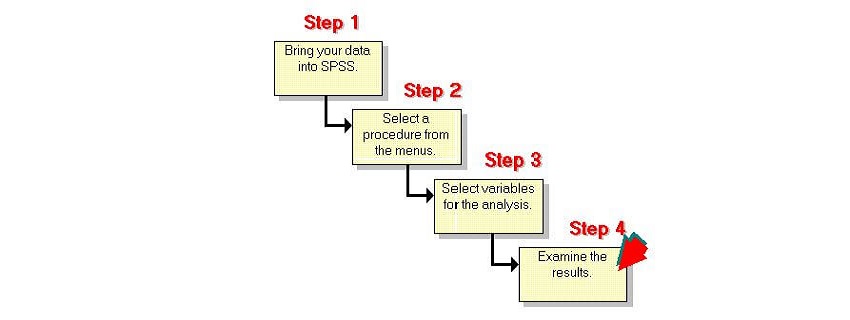
By now, we have learned about the features and advantages of SPSS for data analysis. Now if you’re wondering ‘how to use SPSS software for data analysis, you should follow this step-by-step process-
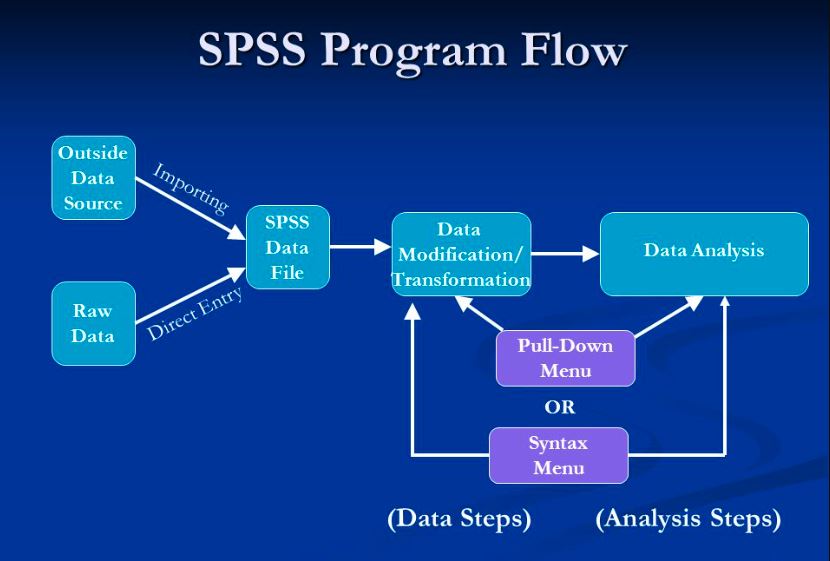
- Put all your data in an Excel file: After compiling the information, make sure the Excel file is up-to-date with all of the tabular forms and data.
- Bring the Excel file into SPSS: If you have an Excel file with your data, you may use it to bring it into SPSS. Analysis of data using SPSS begins processing the data as soon as it is in.
- Give specific SPSS instructions: The SPSS program can be operated using a variety of instructions depending on the kind of data you need to analyse. You can achieve the most precise results by entering all of the options provided by the various tools, each of which comes with its own set of instructions. SPSS’s command structure is intuitive and straightforward, making it easy for students to use it on their own.
- The result: The program provides rapid and accurate findings, allowing researchers to better comprehend the significance of their planned experiments.
- Review the charts and graphs: It can take some time to grasp the implications of the findings. On the other hand, academics can help you interpret your results. You can also get help from a company that offers professional SPSS data analysis services.
- Provide suggestions for outcomes based on your data analysis using SPSS: The SPSS analysis is meant to assist in concluding the research as a whole. With the program, easy inferences and future predictions with little statistical error can be made.
If you need to go specific with even the most difficult data sets, SPSS is your go-to program. As a result, you will have more time to focus on your research’s strengths, such as seeing patterns, building forecasting models, and making valid findings. Thus, using SPSS for data analysis is a win-win situation.