The most critical step after data collection is to perform data analysis. Though several solutions are available, one can analyze simple and advanced data using simple packages such as Microsoft Excel (MS-Excel). One of the most popular tools for data analysis and visualization is Excel. It now has capabilities allowing deeper data analysis, better visualizations, and more complex business logic. This blog presents an overview of MS-Excel along with benefits, learning opportunities, and career opportunities.
MS-Excel
MS-Excel provides a vast range of functions for data management and analysis. A researcher can use MS-Excel for basic data entry, though there are limitations to using the MS-Excel spreadsheet as a data entry function. To start with, you can use it for data entry. Once you have the data in MS-Excel, you can do a range of work, from data management to analysis and representation using inbuilt data visualization tools and statistical functions using add-on packages.
Using MS-Excel functions
MS-Excel is widely used to manage and analyze data using various functions, i.e., statistical and mathematical. If we know the functions needed and use them, we can easily enter them into a cell and analyze them. However, suppose we are unsure about which function to employ for a given job or study or even how to apply a particular function. In that case, MS-Excel can help us locate the appropriate function.
Locating the Appropriate MS-Excel Function
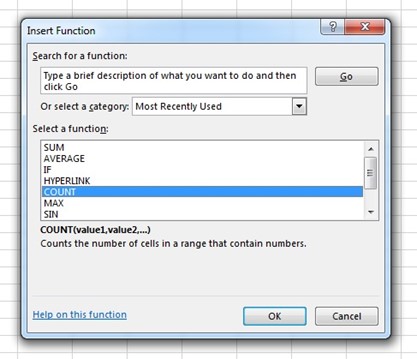
Click the Formulas tab on the Ribbon and then click the Insert Function button in the Function Library group to view the MS-Excel functions. A researcher may also click the button on the formula bar. Either method produces the Insert Function dialog box seen in the following figure:
A researcher can use the insert function feature by clicking on it. In the search for a function box at the top of the Insert Function dialog box, we may enter a brief description of the action we wish to do. After doing so and hitting Go, MS-Excel will search for and present functions that may assist us with our work in the Select a function box. In many circumstances, we may need to explore an entire category of functions to determine what is accessible. The choose a category box is useful for this purpose. It offers a drop-down list of many types of MS-Excel functions. The graph demonstrates that we selected the statistical category. MS-Excel’s functions appear alphabetically in the Select a function box.
Using Pivot Tables in Microsoft Excel
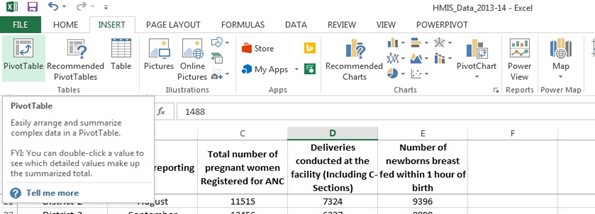
Microsoft Excel’s pivot tables are one of its most powerful features. Data may be easily summarized, analyzed, explored, and presented using pivot tables. Without the need for formulae, pivot tables simplify extracting information from enormous data sets. Pivot tables are intuitive. By dragging and dropping data fields from one position to another or pivoting, we may see the same data in many ways. Let us explore the pivot tables using our dataset and try to analyze the data using pivot tables. But at the first stage, we need to insert a pivot table for our dataset; to do so, one can click on any single cell in the dataset. The researcher can go to the insert tab and click Pivot Table.
MS-Excel automatically selects the data for you. The default location for a new pivot table is New Worksheet. The pivot table sheet will appear. It will have the PivotTable fields on the right side of the screen.
Graphs
Once the researcher gets the data in Excel, they may select from the available graph and chart choices. A researcher can choose alternatives for charts and graphs, including column (or bar) graphs, line graphs, pie graphs, and scatter plots. An insert may be selected once the chart and graph choices have been located. Each sort of chart or graph is described in depth in the chapter on data analysis. It is important to note that different Excel charts require data to be structured differently, and it is simple to organize data in a particular manner before constructing a graph.
The Benefits of Learning Excel
Learning basic and advanced Excel skills has a lot of benefits. Some of the benefits are :
• Enhance performance: With the aid of Excel, you can create more organized spreadsheets. It provides you with a clearer view of the entered information.
• Streamline Work: MS Excel may be used to automate your tasks by using features such as Tables, VBA, Macros, etc.
• Skill enhancement: One of the most widely used computerized spreadsheets is MS Excel. It is because experts in several disciplines find Microsoft Excel useful, including money, accounting, business, data input, information technology, and analysis, science, too.
• Save time: You may automate jobs or learn shortcuts for Excel, which will help you save a lot of time and enhance your productivity.
• Data Presentation and Visualisation: Excel has various charts and graphs that may be used to display your data graphically.
• Enhance career opportunities: Expertise in MS Excel can give your resume a boost. It will help and may improve your career growth.
Related: Tableau: Platform, Career Opportunities, and Skills required
Learning Excel
One can learn advanced Excel abilities in a variety of ways. Your optimal learning strategy will probably vary based on your career timeline, growth requirements, and current knowledge. For individuals looking for a more structured approach to studying Excel, several options include independent study, data analytics boot camps, and certificate courses.
Who should learn Data Analysis?
Anyone looking to better their profession by mastering more sophisticated Excel abilities will benefit from taking the basic course. It includes people who are employed or seeking employment in positions involving, among others, advanced administration, finance, or data analysis. One benefit is that most data analytics courses provide a comprehensive program taught by experienced faculty, preparing you to pursue a rewarding new career in the industry.
Data Analysis Course options and information
One can select from available self-paced or live courses covering basic and advanced skills. The advanced Excel course usually includes using Excel’s IF statements and comparison operators, basic and sophisticated lookups, pivot tables for data analysis and exploration, and computations utilizing Excel’s new dynamic arrays.
You will be able to handle challenging jobs with confidence if you possess these advanced Excel abilities. You’ll be able to enhance your career in either your present position or a brand-new one.
Basic and Advanced Data Analysis course using Excel by Educationnest

The certificate course by Educationnest is an excellent option for enhancing Excel skills. The course would focus on hands-on, project-based learning that replicates real-world situations and rapidly yet efficiently teaches critical skills. A range of past skill levels is also catered for in the course. For instance, the course starts with basic and intermediate Excel abilities that may be built upon for advanced Excel expertise.
After finishing the course, you can use sophisticated Excel functions, imaginative visuals, and robust automation capabilities to make data come to life. With the course you will graduate from these courses with a full set of tools for connecting, manipulating, and analyzing data. Additionally, you will become proficient with a wide variety of charts and will build gorgeous interactive dashboards.