In today’s world, businesses are moving at great speeds and need to make quick and informed decisions each day. Every organization is constantly bombarded with large amounts of data and needs a smart system to sort and use this data to reach its goals. One way of reaching business goals is by employing BI and Data Visualization software.
Business intelligence tools
A business intelligence tool, sometimes known as a BI tool, is a software application used to compile, analyse, and visualise huge amounts of data. This data processing is done in order to produce valuable business insights and interactive reports and to make decision-making easier. These BI solutions provide elements like KPI scorecards, visual analytics, interactive dashboarding, and data visualisation.
Data visualization tools

A data visualization tool is a piece of software that transforms data from a single source into illustrative graphs, tables, charts, and dashboards. Everything FROM a basic pie graph to a detailed interactive choropleth—can be made using data visualization tools.
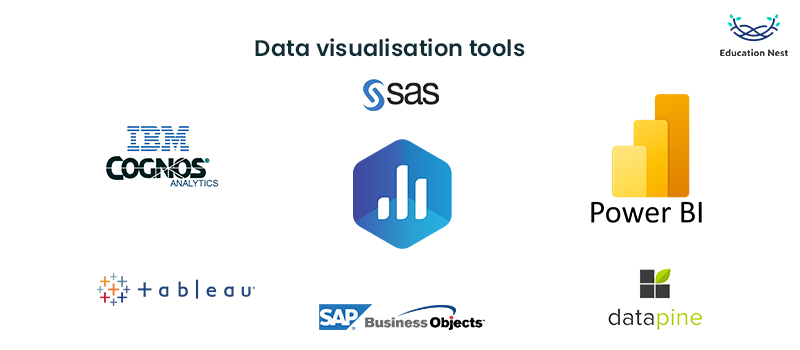
Let’s have a look at some of the most popular Data Visualization and Business Intelligence tools:
Tableau
Tableau is a business intelligence application with a focus on data discovery and data visualization. It helps large corporations in analysing big data. One can quickly analyse, visualise, and share data using the software without any assistance from IT Personnel.
Tableau supports various data sources, including MS Excel, Oracle, MS SQL, Google Analytics, and SalesForce. It is a free platform where users also have access to user-friendly dashboards that have been thoughtfully built.
Tableau also provides a number of independent solutions, such as Tableau Desktop, Tableau Server, Tableau Online, and many others.
Datapine
Datapine is a user-friendly BI tool application that can be used to explore various data sets, identify trends, and create personalised reports.
Datapine has a user-friendly drag-and-drop interface, simple predictive analytics, a variety of reporting choices, and a selection of interactive dashboard capabilities. Its all-in-one business intelligence platform simplifies the challenging process of data analytics.
Datapine gives users insightful information and issues alarms using artificial intelligence. It employs a quick and speedy self-service analytics approach.
SAP Business Objects
SAP business objects is a package BI tool made for in-depth reporting, data analysis, and data visualisation. It allows users to develop live presentations and hybrid analytics and connect them to their on-premise and cloud SAP systems.
SAP lets its users create their own dashboards and applications using the platform’s self-service. It is a powerful programme with a variety of features that are designed for all jobs (IT, end users, and management).
The platform places a lot of emphasis on areas like digital supply chain, ERP, customer experience (CX) and CRM. Although, the product’s sophistication does increase the price.
You Must Like: Splunk 101: A Beginner’s Guide to Harnessing Its Power
SAS Business Intelligence
SAS BI provides a great business intelligence platform. It uses simple language explanations to help users gain an understanding quickly with automated analysis supported by machine learning. It helps to visually analyse all important information to instantly discover hidden patterns.
SAS assures high-level data integration and sophisticated analytics & reporting. Users have several possibilities for customisation when using their set of APIs. They also have a great text analytics option that provides users with more contextual information about their data.
Strong visuals make it easier to understand what the data is telling its users. One can understand the interactive visualisations that are supported by analytics with the aid of powerful visualisations and interactive dashboards. SAS aids in analytics, reporting, data mining, and predictive modelling.
Microsoft Power BI
Power BI is a group of software services, applications, and connectors that combine to transform your diverse data into meaningful, engaging visuals and interactive insight.
Microsoft Power BI visualisation tool is a web-based package of corporate analytics tools that excels in data visualisation. Its features let the user identify patterns in real time and help improve their campaigns.
Users can deliver reports and real-time dashboards using this software, as well as integrate their apps. An Excel spreadsheet or a combination of cloud/premise-based hybrid data warehouses can serve as the input data.
Power BI makes it simple to connect your data sources, view the data, identify the most important information, and share it with whomever you want.
DataBox
DataBox is a unique platform for developing analytics apps for PCs and mobile devices. The DIY dashboard builder in this data visualisation tool can be used with a variety of data sources. Additionally, a selection of templates is available for users to choose from.
The major messaging on their website serves as their key tool, aiding data analysts in performance prediction. Marketers like HubSpot can benefit greatly from DataBox’s templates.
Popular metrics and their standard visualisations are already included in all Databox connections. Users can then spend more time acting on the data and less time figuring out how to visualise it. Combining metrics from several sources in one dashboard enables quick access to a more comprehensive picture.
IBM Cognos Analytics
IBM Cognos is an Artificial Intelligence powered business intelligence tool that supports the whole analytics cycle. It covers all facets of business intelligence, from discovery to operationalisation. Users are able to visualise, analyse, and share relevant insights about their data.
The data in Cognos is analysed and presented in a visually appealing form. It enables the viewer to identify hidden patterns. Cognos is a rather complex software application. Thus, becoming familiar with all of its functions can take some time.
Cognos is a cloud-based BI tool that uses AI recommendations appropriately when building dashboards, reports, and GIS tools to connect company data with the real world.
Cognos has the option of filtering and remembering user queries. Its search function enables users to explore, find, and access the recently used content within the software.
Additionally, Cognos has the special ability to combine many data sources into a single data module, enabling users to create and use insights independently. Advanced data analytics are integrated with embedded geographic mapping and interactive visualisations.
Now that we have learned about some of the most popular BI and Data Visualisation tools, it is safe to say that they are crucial components of data science since they combine all the data, cutting down human labour. They are available around the clock and aid in prediction. All businesses, small and large, can benefit from these advantages. BI is the right approach if an organisation wants to manage their data and learn more about it.

